Many investors lack the capacity to closely track the performance of their loan participations, even though performance tracking is crucial for loan participations just as for any other asset.
The failure is understandable. Loan participations pose additional difficulties on top of the existing difficulties already posed by tracking loan performance more generally as an asset class. A portfolio of loan participations can contain multiple different loan asset classes, loan vintages and loan originators. How is an investor supposed to consolidate all the relevant data and analyze each kind of loan participation in its appropriate way, every month? Analyzing the monthly performance of even a modestly-sized participation portfolio would require a full-time analyst, if not two.
LoanStreet realizes that no loan participation program is complete without a suite of reliable and automated performance analytics. The platform already offers its users automated pool-level analyses of prepayment, charge-off and delinquency rates, as well as coupon and credit score migration. LoanStreet’s new Performance Analytics product now makes a major addition to this suite of analytical tools by offering two critical analyses of pool return: Cost-Basis Return and IRR Scenario Analysis.
These new and powerful metrics, Cost-Basis Return and IRR Scenario Analysis, present two complementary ways of analyzing loan participation returns; whereas the first is focused on the income currently generated by the asset, the second is focused on the asset’s likely overall return to the investor. A forthcoming article will focus on IRR Scenario Analysis and how LoanStreet handled the problem of calculating IRR despite uncertainty regarding future prepayment and charge-off rates. This article will discuss the novel Cost-Basis Return metric: its motivation, the formula behind it and how it complements the better known metric of IRR.
Traditional Performance Ratios: The Problem of Price Observability
Traditional performance analyses like Return on Investment and Holding Period Return all measure, in slightly different ways, the net return of an asset over some period relative to the price of that asset at the beginning of the period.
Thus, in order to calculate most performance ratios, the analyst must know the price of the asset as it changes over time. For example, Holding Period Return requires knowledge of the price of the asset at the beginning and end of a period, as well as the income received during that period:

In liquid fixed-income markets like corporate and government bonds, pricing information like this is more or less easily acquired, and the holding period return can be more or less easily calculated.
The situation is critically different for loan participations. Loan participations are typically held to maturity; there is no liquid secondary market; and, mid-flight pricing information is therefore nearly impossible to derive. Thus, to calculate any performance ratio, the analyst must find some proxy for pricing information.
After an exhaustive search for a meaningful performance ratio for held-to-maturity assets with limited price observability, LoanStreet has developed an innovative approach that leverages the asset’s cost basis to calculate a new and powerful performance metric.
Introducing the Cost-Basis Performance Ratio
To address the lack of observable secondary market information around loans, LoanStreet has borrowed from accounting and tax concepts and constructed a novel performance ratio for held-to-maturity assets like loan participations: Cost-Basis Return.
Similar to how an investor amortizes the premium paid for an investment over its lifetime (or, conversely, accretes the discount), LoanStreet adjusts the original price of the investment over time and uses this adjusted “cost basis” figure to calculate a monthly performance ratio.
When calculating the return of an asset purchased at a premium, the formula would be the following:

When an asset is purchased at a discount, the formula is analogous:

Cost-Basis Return is not equal to Return on Investment, Holding Period Return, or any other existing performance ratio. It is an alternative performance metric that applies the tax and accounting concepts of amortization (or accretion) to approximate the trajectory of an asset purchased at a premium (or discount) as it tends toward par value over its lifetime.
Cost-Basis Return is superior to any performance ratio that ignores the premium or discount at which an asset was purchased. Such performance ratios will systematically over- or understate a buyer’s returns, respectively.
Essential to the calculation of Cost-Basis Return is the investor’s choice of amortization (or accretion) methodology. Just as different amortization (or accretion) schedules can affect the value at which the asset is held on the investor’s books, these different schedules will also affect the Cost-Basis Return values. If the investor’s chosen schedule aggressively amortizes premium in the first months of an asset’s life, for example, this approach will accordingly depress the Cost-Basis Return for those months.
Additionally, Cost-Basis Return makes the assumption that an asset’s price steadily (i.e., monotonically) decreases or increases. When asset price movements prove to be more complex — such as when an asset is sold at a premium but descends below par before eventually returning to par — Cost-Basis Return can also potentially under- or overstate returns at different moments in time.
Cost-Basis Return Versus Internal Rate of Return
Internal Rate of Return (IRR), the “gold standard” in evaluating investment performance, is without a doubt an indispensable tool. It is a rigorous method for distilling a whole time series of cash-flows into a single number, with which the investor can easily compare investment returns against one another. IRR is not without its limitations, however, and these limitations leave a significant role for other investment metrics to play in managing a loan participation program.
The problems with IRR arise from the fact that its calculation requires knowledge of all cash-flows, from origination to maturity. When evaluating a fixed-income asset mid-flight, this means forecasting future cash-flows — not a trivial task. There will always be uncertainty about future prepayment, default and loss amounts, and this uncertainty will translate into a range of likely IRR values – not a single point estimate.
Moreover, as a single number summarizing an asset’s performance over its lifetime, IRR does not offer any information about month-to-month performance or cash-flows. Two assets with very different cash-flows might have the same IRR: in the first, large positive cash-flows might be front-loaded at the beginning of the asset’s life; in the second, those positive cash-flows might be smaller and evenly spaced over the asset’s lifetime. Although these distinctions can be crucial to investors as they manage monthly operational and liquidity needs, IRR ignores them.
By contrast, Cost-Basis Return is free of both of these limitations. Cost-Basis Return requires no opinion about likely future prepayment or default rates and is highly sensitive to variability in cash-flows over time. Cost-Basis Return offers investors a relevant and certain perspective on what income the asset is currently generating – a perspective that IRR, despite its sophistication, does not provide.
Cost-Basis Return in Action
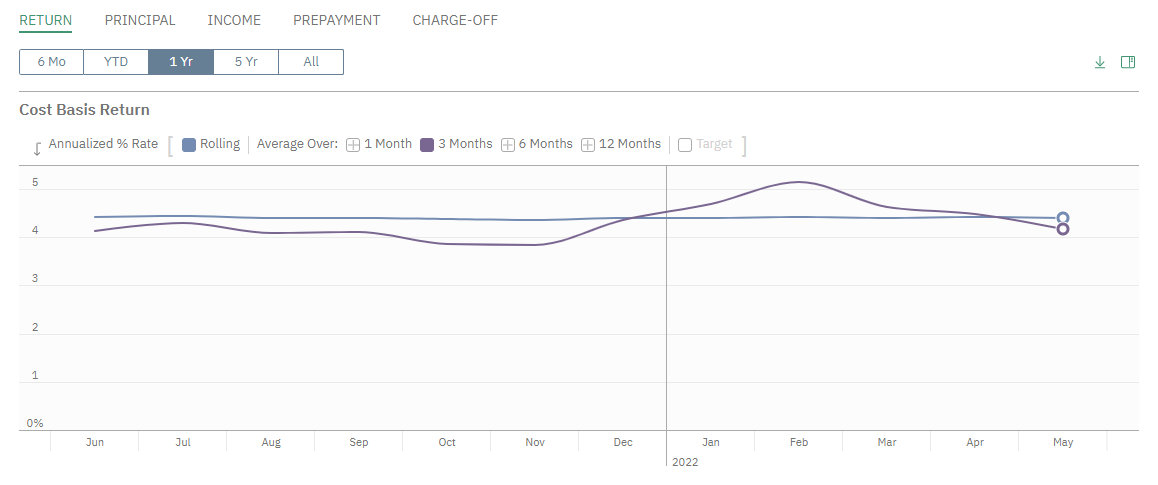
When a loan participation exhibits minimal charge-offs, the Cost-Basis Return tends to hover around the participation’s overall coupon, such as in this pool of auto loans with a weighted average coupon of 4.6%:

From month-to-month, the 3-Month Rolling Average Cost-Basis Return (purple) dips slightly below and above the Lifetime Rolling Average (blue) in response to coupon migration as well as monthly variation in prepayment and delinquency rates.
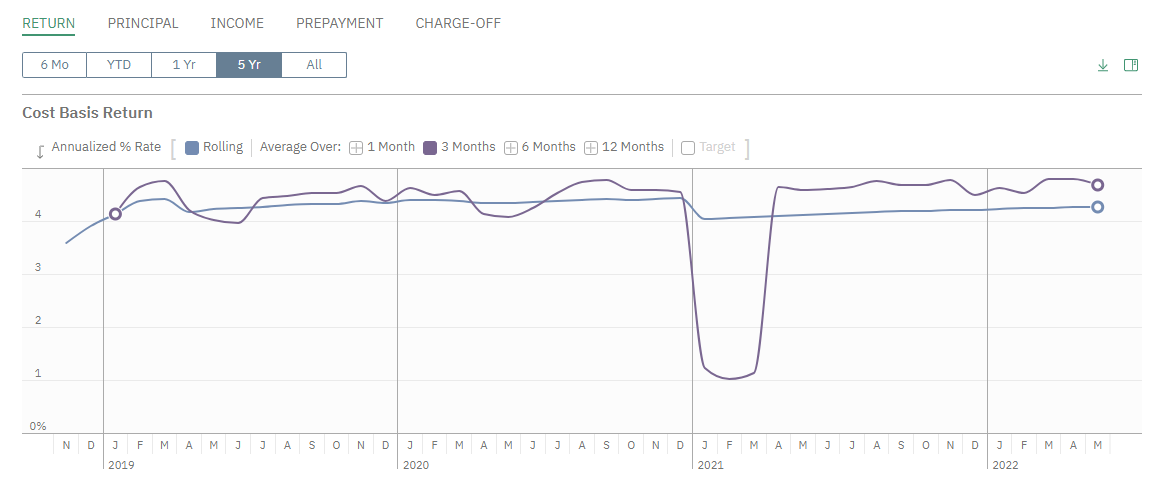
When isolated charge-offs occur, the effect upon Cost-Basis Return is noticeable:

In this second pool of auto loans, the 3-Month Rolling Average Cost-Basis Return generally oscillates above and below the coupon rate of 4.5%, but then precipitously drops when a charge-off occurs in the winter of 2021. The Lifetime Rolling Average is also affected by this charge-off event, but when averaged over the pool’s experience to date, the overall effect is a small downward shift in the graph that is eventually recovered over time.
Cost-Basis Return and IRR, Side-by-Side
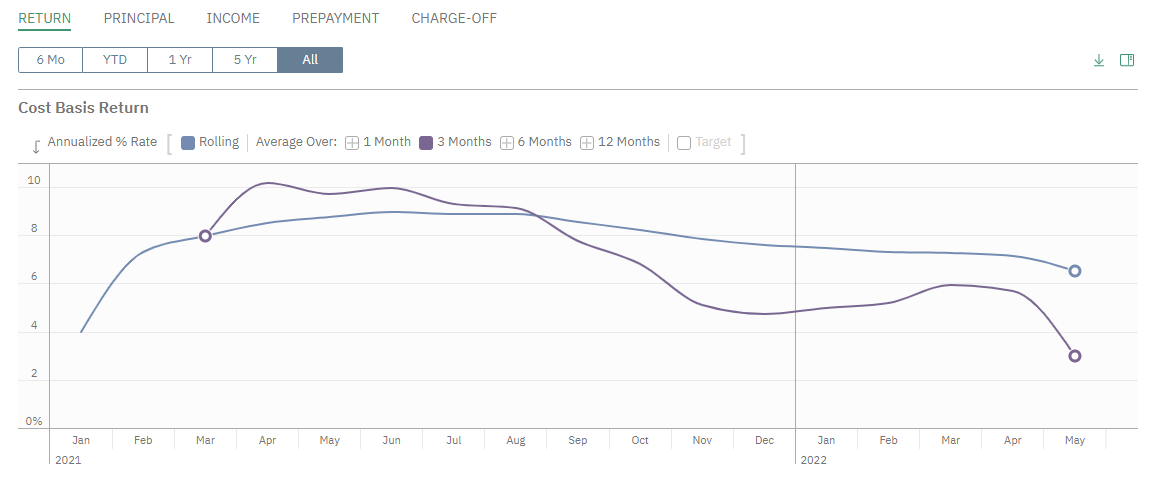
Finally, let’s focus on the complementary nature of IRR and Cost-Basis Return by examining a pool of unsecured loans with a relatively high weighted-average coupon of 10.9% and a significant default rate:

To calculate a likely range of IRR values for this pool, we first must place some bounds around our future prepayment and charge-off expectations. To date, the pool has roughly averaged a 25% CPR prepayment rate. Taking a conservative (perhaps pessimistic) approach, we input into the LoanStreet analytics engine lower and upper bounds of 20% and 35%, respectively. Following a similar approach for charge-offs, we note the pool’s lifetime average CDR rate of 1.5% and accordingly input lower and upper CDR bounds of 1% and 5% – leaving ample room for the charge-off rate to accelerate in the future.
Given these future charge-off and prepayment assumptions, the LoanStreet analytics engine yields expected IRR values between 6.75% in the best case and 5.5% in the worst. Meanwhile, the 3-month Cost-Basis Return has recently dipped to 3% in May 2022.
Despite the distance between these two sets of figures, there is no contradiction here; in fact, we are perceiving the pool from two different and informative perspectives. This pool’s strong initial returns are compensating for the losses it is experiencing right now, in the middle and end of its life. At this point in the pool’s life, the pool’s short-term cash-flows relative to its size only amount to a 3% Cost-Basis Return and may even dip further. In the context of the pool’s strong initial cash-flows and likely future cash-flows, however, the lifetime IRR of the pool promises to be at least 5.5%.
Conclusion: A Complementary Analysis
Although IRR is the “gold-standard” in investment return analysis, Cost-Basis Return lends context to IRR and presents information that IRR cannot. Whereas IRR indicates where a pool’s performance is ultimately headed, Cost-Basis Return indicates where the pool’s performance currently stands — which is critical information to manage monthly operational liquidity. LoanStreet’s new Performance Analytics brings these two metrics together, enabling investors to maximize the performance of their participation program with actionable information and insights.
1 For a loan participation buyer, “Income” would represent the sum of net interest and late fee cash-flows minus net charge-offs. For a seller of a loan participation, “Income” would also include servicing fees.
Author: Douglas Callahan, Vice President of Data & Analytics, LoanStreet, Inc.
