
LoanStreet Monthly Newsletter — April 10, 2025
This month we dive into the nuances of comparing and analyzing various pools of loans. In particular, we take a look at factors that are often overlooked but have a material impact on the yield. We will start with a recap of an active economic news cycle and share our observations on loan trading. Enjoy, share and please comment below!
LoanStreet Market Commentary
Talks of stagflation continue on fear that tariffs will bring down economic growth while keeping inflation elevated. The recent hard data has been mixed but it’s important to note that this data is backwards looking, and with the high velocity at which breaking news is announced, much of this data is outdated by the time it is released.
Nevertheless, the CPI data for February showed both the headline and core coming in 0.1% below expectations. This was offset by the PCE index coming in 0.1% above expectations. Further, inflation expectations one year out and 5-10 years out both came in above expectations. On the labor market side, the latest jobs report came in well above expectations, at 228k versus the 140k expected change in nonfarm payrolls.
These datapoints suggest that the current level of inflation has normalized, although it is projected to pick up, and that the job market remains strong. That being said, consumer spending has stagnated, suggesting the US consumer is turning cautious. The threat of tariffs has introduced significant uncertainty into the market as the impact the tariffs will have on inflation is not yet known.
Loan Trading Trends and Implications
The recent volatility in interest rates has made the pricing of loans challenging. On the one hand, benchmark yields have dropped, with the 2-year Treasury yield down 30bps over the last month and hitting a 52-week low in early April. On the other hand, yield levels are dropping due to fears of an economic slowdown, which increases credit spreads. To what degree these two factors cancel each other out is yet to be determined and may vary for different types of loan products.
The trend of strong buy-side demand, which started in February, has continued. Because of this, yield spread on pools have dropped materially from the start of the year. Recently, sell-side volume has also increased, as credit unions take advantage of the sellers’ market and position their balance sheets should a recession materialize or loan demand increases with the start of the typical car buying season. This balance of buyers and sellers (and increased uncertainty) has resulted in pool yields holding still even though Treasury yield levels have dropped.
A trend that continues to be apparent is buyers skewing towards super prime and conservatively underwritten collateralized pools. Further, there is a strong preference for sellers with a strong performance history. We note that attractive loss-adjusted yields can be had for buyers willing to go outside the conservative buy-box and consider credit unions that have underperformed their peer groups.
Deep Dive: Yield Under the Microscope
In this month’s edition of the LoanStreet Beat, we reached out to our network of credit unions in order to get feedback from someone directly involved in the day to day operations of the credit union. The following was put together by Ann Ditlow of 4Front Credit Union, a $1.05B credit union out of Michigan. Ann is the finance and analytics manager.
Pool Level vs Loan Level
We will first take a look at the most common mistakes we encounter among credit unions. Oftentimes, when evaluating a pool, a buyer will look at the pool level statistics, ignoring loan level details. Because of this, buyers are ignoring coupon drift and/or underestimating their loss estimates.
Related to loss estimates, by simply evaluating the pools at a weighted-average basis, the amount of risk might be misjudged. As an example, suppose you have the two pools below:
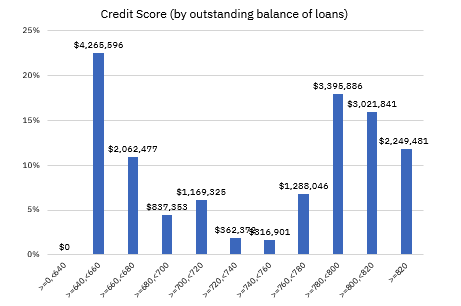
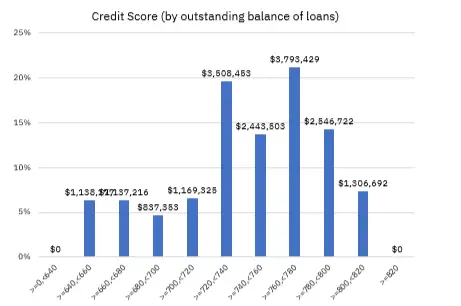
Both of these pools have a weighted average credit score of roughly 740, but the first example has far more loans at the tail end of the distribution. The degree to which losses are lower at the 780+ credit scores, does not offset the degree of losses at the sub 660 credit score level. By evaluating the distribution of credit scores, DTIs and LTVs at the loan level, buyers will have a clearer picture of the risk profile of the pool.
As it relates to coupon drift, as loans in a given pool pay-off and drop from the pool, the overall weighted average coupon (WAC) on the pool will change over time. As an extreme example, suppose you have two loans in a pool with the same balance, one is a 10% loan with a 24 month term and another is a 5% loan with a 60 month term. The initial WAC on this pool is 7.5%, but after 24 months, or sooner if you include prepayments, the WAC will drop to just 5%. By simply taking the initial WAC into account when calculating yield, you are ignoring the changes in WAC over time. This is particularly important if rates continue to come down, as more seasoned loans, with shorter remaining terms, will have higher coupons than the newly originated, longer remaining term, loans.
The best way to combat these effects is to evaluate everything on a loan level basis. Laying out the cashflows for each loan in the pool over time will capture the coupon drift, while showing the distribution of loan parameters within the pool will bring to light any fat tails.
Delay Days
When buying a participation, the usual expectation is that you will receive payments for all the loans at the start of the month following when the payments were made. For example, you would receive payments for March activity on April 3rd. This delay introduces a drag on the yield. As we’ve written about in the past, the impact of the delay days can reduce the yield by a material amount and should not be ignored. For buyers evaluating a deal, it is important to consider how quickly the seller is able to remit the funds to you. As a seller, make sure you have the proper procedures to remit funds in a timely manner to ensure you are not adversely impacting the yield on the pool.
Accrued Interest
Generally speaking, loans purchased in a pool have already closed and have been making payments and accruing interest. At the time of the sale, the buyer needs to pay the seller for the interest which has accrued from the last payment date until the day of closing. This is because the buyer will receive the full payment once made, even though they didn’t own the loan for the full period covered by the payment. The accrued interest paid at closing needs to be considered when evaluating a pool. This is especially important should the loans in a given pool pay on the first of the month while the closing occurs at the end of the month, the accrued interest for the whole month could be meaningful.
Loss Assumptions
One of the bigger unknowns when evaluating a loan pool is the degree to which the loans are likely to charge-off. When evaluating the appropriate yield on a given set of loans, we have three components; the benchmark yield, the loss assumption and the spread. The benchmark yield is known as it is the appropriate Treasury yield (i.e. 2 year), the loss assumptions need to be determined based on available data, and the spread is driven by the market. For example, if we use a 3.75% Treasury yield, add .50% in annual losses and a 1.5% spread, we would target a pool yield of 5.75%. Of the three inputs, the loss assumption is the most uncertain and the assumption can vary depending on the buyer’s view of the economy and their perceived risk. This is where we see the most disconnect between what the sellers think their loans are worth and what the buyer is willing to pay for them. For this reason, it is important for the seller to provide clean and easily interpretable data, which usually means static loss data based on origination vintage. For the buyer, it is key to know how to interpret this data and how to adjust the forward looking projections based on the current state of the economy.
As we have written in the past, origination volumes can distort annual loss figures for a given seller. Strong origination volumes hide potential increasing loss numbers while a decrease in origination volumes will inflate annual loss figures and recent originations are not offsetting the increased charge-offs of seasoned loans.
Prepayment Speeds
A performance metric which is sometimes overlooked is prepayment speeds. As we’ve noted in the past, prepayments speeds can have a material impact on the level of actual yield being realized by the buyer. This is particularly true for pools which are being purchased at high premiums. Because premiums are amortized over some predetermined length of time, high prepayments shorten that timeline and therefore accelerate the recognition of those premiums, lowering the yield. As an example, suppose we have two pools, one at par and another at a 105 premium. Here is the impact on the yield, ignoring losses, between the two as prepayment speeds increase.
| Price | ||
|---|---|---|
| CPR | 100% | 105% |
| 0% | 6.63% | 5.77% |
| 10% | 6.55% | 5.28% |
| 15% | 6.51% | 5.01% |
| 20% | 6.48% | 4.72% |
As can be seen in the table, the change in yield from 0-20% is only 15bps on the par pool but 105bps on the 105% price pool. The reason the yield on the par pool changes at all is related to the points we discussed above, higher prepayment lowers the WAL and amplifies the impact of delay days and accrued interest.
Putting It All Together
While on the surface the process of evaluating pricing and yield for a given pool of loans seems simple – calculate the coupon, subtract loss assumptions and compare the return to some benchmark – there are nuances that impact the yield and are often ignored or overlooked as de minimis when frequently those differences are quite material. By having an understanding of what others gloss over, you’ll find yourself in a better position to purchase the most advantageous opportunities.
Monthly Economic Data Summary
- Based on the 3/28/2025 report, the PCE gauge of inflation increased 0.3% MOM and up 2.5% YOY. Both in line with estimates.
- From the same report, core PCE, which excludes food and energy, rose 0.4% MOM and 2.8% YOY. Both 0.1% above estimates.
- On 3/12/2025 we received the latest CPI gauge of inflation, the headline was an increase of 0.2% MOM while the YOY was up 2.8%. Both 0.1% below estimates.
- The latest job report for March showed a 228k increase in nonfarm payrolls. Above the 140k which was estimated.
- The latest used-vehicle Manheim Market Report for mid-March showed a decrease of 0.2% from a year ago.
- The Case-Shiller home price index showed national home prices increasing MOM by 0.2% while increasing YOY by 4.1%. These are lagging data and reflect the CS indices for 01/25.
- Based on the CME market watch tool, the expectation is for the first rate cut of 2025 to happen in June with a slightly less than 50% chance of a May cut.
This article was authored by Matt Rudzinski, VP of Capital Markets
For more market commentary and to learn more about LoanStreet’s solutions, visit www.loan-street.com
Disclaimer
LoanStreet is not a Registered Exchange, Financial Planner, Investment Adviser, or Tax Adviser. The information provided herein is for general informational purposes only, and does not, and is not intended to, constitute legal, financial, investment, or tax advice.