
LoanStreet Monthly Newsletter — September 4, 2024
In this month’s edition of The LoanStreet Beat, we do a deep dive into the recent innovation that LoanStreet brought to the participations market – the negative servicing spread trade. Because of the nature of mortgage behavior when interest rates change, this is not as straightforward as simply receiving additional net interest. In addition, we recap an active economic news cycle and share our observations on loan trading. Enjoy, share and please comment below!
LoanStreet Market Commentary
While the month started with concerns over the labor market, those concerns have been somewhat eased by the data released throughout the month. The August report for jobs created in July came in well below expectation at 114k, compared to the 175k forecast. Further, the unemployment rate rose to 4.3%, a 0.2% increase from the month before. About a week later, on August 8th, we received the latest jobless claims numbers, which declined by most in almost a year. Additional reports also showed strong consumer spending which helped alleviate concerns of a weakening economy.
Moving on to inflation, the latest reports continue to show progress is being made. July inflation came in 0.2% MOM, in line with expectations on both the headline and core numbers. While the YOY headline number came in slightly below expectations at 2.9%, compared to the 3.0% expected, the lowest since 2021. The inflation index continues to be dominated by shelter costs, which increased 0.4% MOM. With shelter accounting for roughly 36% of the index, it continues to have an outsized effect on the print. At the end of the month, the latest PCE data further solidified that inflation is cooling with numbers coming in largely as expected by the economists. Of note was the three-month annualized core number, which came in at 1.7%, the lowest reading this year.
One of the most anticipated events this month was the Fed Chair Powell’s speech at Jackson Hole. The speech largely delivered what the market was hoping for as Powell signaled it that the “time has come” for rate cuts. Now the big question will be how quickly the Fed should cut rates. This will largely be determined by the September 6th job’s report. With the risk associated with an reacceleration of inflation dwindling, all eyes will be on any data points which signal a slow down in the jobs market and the economy.
Loan Trading Trends and Implications
As Treasury yields have drifted lower, so have the yields on participations. That being said, with concerns over losses, credit spreads have widened, resulting in participation yields not dropping as quickly as Treasury yields as buyers demand higher spreads to compensate them for the perceived higher risk of losses going forward.
The loan participation marketplace continues to be balanced. We are seeing strong buy-side demand which has been matched with ample supply, with buyers focused on loan and seller quality, even if it means a lower yield. For that reason, it is important for sellers to provide clean and useful performance data. Ideally, this means static loss data by credit score, LTV, and term. The more granular the data, the better. As discussed in our previous LoanStreet Beat, the pools we put together are generally a conservative subset of the seller’s portfolio. Many buyers look at call reports, which don’t provide granular data. If the seller provides loss data by credit tier, it improves our ability to correctly price the pool and it gives buyers a better idea of how the actual pool being marketed might perform as opposed to how the overall portfolio is performing.
In conversations with our clients, liquidity appears to be improving, although this is mostly driven by a slow down in origination volumes rather than an uptick in deposits. Should this trend continue, buy-side demand for participations should continue to grow, driving spreads tighter. The caveat being the uncertainty around how rate cuts will impact loan demand. Should consumers remain confident in the job market and have ample savings, any reduction in rates should spur demand for loans. On the other hand, and as suggested by recent data, with personal savings dwindling and labor market concerns accelerating, the impact of rate cuts on loan demand might be muted.
Deep Dive: Double Negatives
LoanStreet recently unveiled a new concept in loan participations, the negative servicing spread (“NSS”) participation. In this NNS trade, instead of the seller capturing the traditional servicing spread, which reduces the interest passed through to the buyers, the seller pays an additional fixed spread in addition to the pool’s interest.
While this concept is simple, the implications with respect to valuation are not. Mortgages, like some other assets such as callable corporate bonds, municipal bonds with sinking schedules, and some Treasurys, have embedded options that allow some or all of the principal to be paid ahead of schedule. However, the holder of the option in assets other than residential mortgages are generally “efficient exercisers”, meaning that if the option is in the money (they can borrow at a lower rate), they will pay the borrowing off early, and if it is out of the money (they can only borrow at a higher rate), they will usually not exercise the option and leave the balance outstanding.
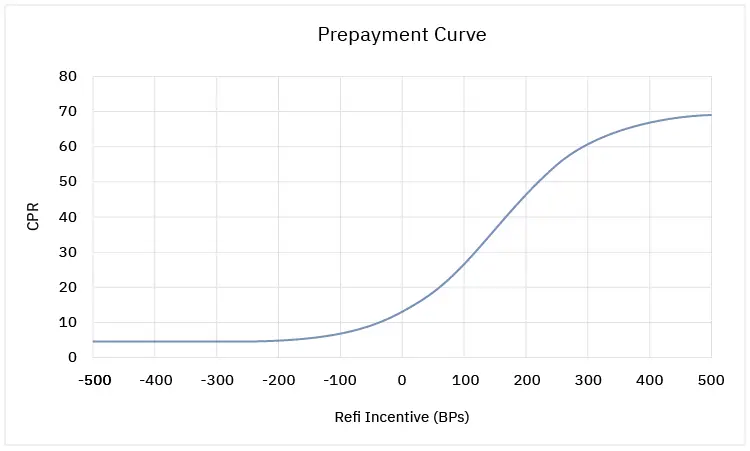
Residential mortgage borrowers, however, are generally inefficient exercisers of the option. They will sometimes pay off their mortgage early even though current borrowing rates are higher than their existing one (usually because they are moving), and often will not pay off their mortgage early no matter what the incentive (there are still a few FNMA loans with rates over 10% outstanding). This creates a prepayment curve that starts low, though not 0, for loans that are deeply out of the money, rises slowly until the refinancing incentive goes to 0, then much more rapidly as the incentive grows. An example prepayment curve is shown below with the x-axis being the refinancing incentive, the difference between the rate on the loan and current mortgage rates in basis points (bps). At 0 refi incentive the expected prepayment rate is roughly 13 CPR, and will drop as low as 4 for deep-out-of-the-money prepayment options and rise to 70 for deep-in-the-money prepayment options.
Note that we are simplifying the prepayment model for purposes of this article. In reality, these would be seasoning curves where the rate varies over time, particularly for the high prepayment rate scenarios, primarily due to the “burn-out” effect that occurs when loans that are likely to prepay have done so leaving those borrowers who are less likely to prepay regardless of incentive to become larger and larger portions of the pool. For instance, if mortgage rates were to drop 300 bps, the prepayment rate wouldn’t instantaneously go to 60 and stay there for the remaining term of the loans, but rather it would stay low for a month or two as people fill out applications, then rise rapidly to something higher than 60, then begin to burn out, declining over time to a much lower number. While there are a number of ways to combine this chain of prepayment rates, the LoanStreet trading desk prefers the weighted-average life (WAL)-equivalent approach where a single rate is solved for that gives the same WAL as the monthly series of prepayment rates.
This creates an unusual situation for mortgages in that when rates decline, which would ordinarily mean the price of a fixed-income asset rises, prepayments accelerate, shortening the average life which compresses the price when it is a premium. As an example, let’s consider two new 30-year mortgage loans, both 6.5% gross interest rates with 50 bps of servicing. Both are expected to prepay in the current rate environment as per the graph, at roughly 13 CPR. However, the first loan has no interest rate sensitivity and will prepay at 13 CPR regardless of rates, while the second loan will follow the prepayment curve as the refi incentive increases or decreases. We will further assume the market requires a 6% monthly interest rate on loans of this type, no delay days, and that all rates move in parallel, i.e., mortgage rates move the same as the required yield. The following graph shows the price of each loan as rates change.
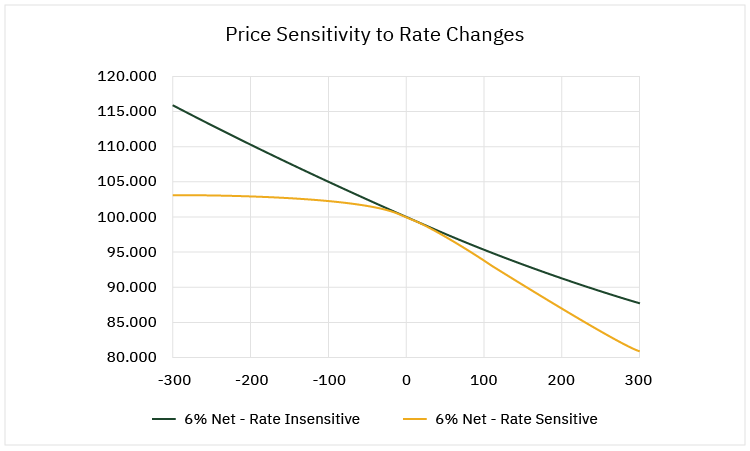
The rate-insensitive loan displays what is called positive convexity – the price rises at an increasing rate as rates fall and falls at a decreasing rate as rates rise. The rate-sensitive loan shows negative convexity – the price rises at a decreasing rate in response to falling interest rates and falls at an increasing rate as rates rise. As one might expect, investors need to be compensated for this feature, which is why even government-guaranteed mortgages trade at a spread to US Treasurys.
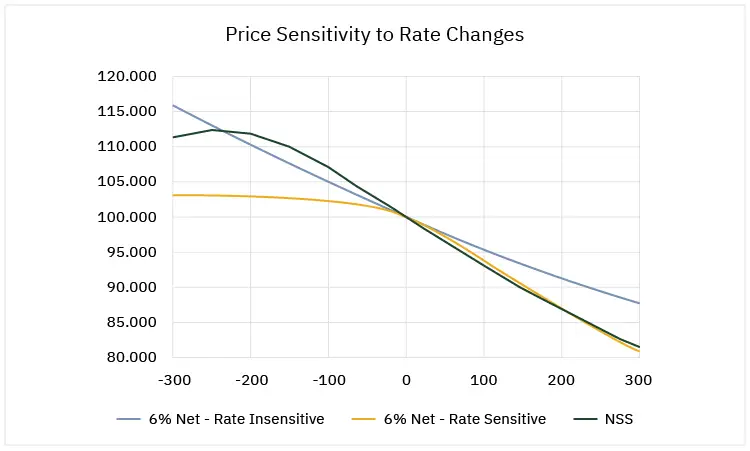
But what happens in the case of an NSS loan where the prepayment rate is based on a loan rate a good number of basis points below the net rate on the loan? The following graph shows the results – while there still is negative convexity, it is not as extreme until rates decline significantly, and the price rises much more rapidly (and in fact, more rapidly than the rate-insensitive loan) while not experiencing significantly worse performance when rates rise.
Some sellers include an optional termination date when selling loans with a negative servicing spread. This is intended to help manage the liability of their obligation to continue to make payments and as such, should not be rate-sensitive. The following graph shows the impact of adding this feature on the price sensitivity to changing interest rates (we’ve removed the rate-insensitive curve from the graph for this one).
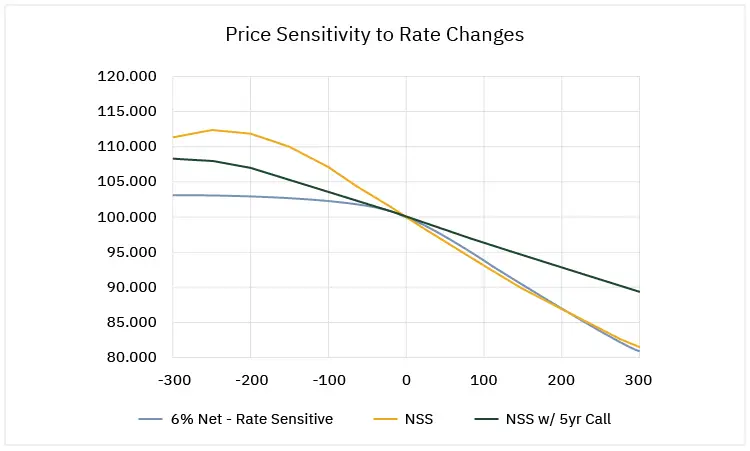
Adding the call feature, while limiting the upside to a degree, still leaves a loan that outperforms a non-NSS loan when rates decline, and materially outperforms when rates rise (assuming that the call is not rate-sensitive).
Of course, the real world is a bit more complicated than the above examples. As prepayment rates change, so does the weighted-average life, and therefore the benchmark against which the loans would be priced, nor do rates usually move in lockstep. Furthermore, the spread on an NSS loan would be tighter than for a non-NSS one, so in the examples above, it would likely be priced slightly higher. While this would change the shape of the curves in the above examples, as well as shift them slightly, it would not change the overall conclusion: negative servicing spread transactions are an innovative way for a buyer to gain mortgage exposure while not taking on the traditional negative convexity of a standard mortgage loan.
Monthly Economic Data Summary
- Based on the 8/23/2024 report, the PCE gauge of inflation increased 0.2% MOM and up 2.5% YOY, both in line with expectations
- From the same report, core PCE, which excludes food and energy, rose 0.2% MOM and 2.5% YOY. The monthly number was in line with expectations while the YOY number came in .1% below forecast.
- On 8/14/2024 we received the latest CPI gauge of inflation, the headline was an increase of 0.2% MOM, in line with the estimate. YOY the headline number was +2.9%, compared to the +3.0% estimate.
- The latest jobless claims report for the week ending August 24th, showed a decrease of 2k claims to a total of 231k, compared to the expectation of 232k. The continuing claims climbed by 13k to 1.868MM.
- The latest used-vehicle Manheim Market Report for mid-August showed an increase of 0.5% MOM, but still down -4.5% YOY, on an adjusted basis.
- The Case-Shiller home price index showed national home prices increasing MOM by 0.5% while increasing YOY by 5.4%. These are lagging data and reflect the CS indices for 06/24.
- Based on the CME market watch tool, the expectations of the first rate cut remain in September 2024, with a ~30% probability of a 50 bps cut.
This article was authored by Matt Rudzinski, Director of Sales and Trading.
For more market commentary and to learn more about LoanStreet’s solutions, visit www.loan-street.com
Disclaimer
LoanStreet is not a Registered Exchange, Financial Planner, Investment Adviser, or Tax Adviser. The information provided herein is for general informational purposes only, and does not, and is not intended to, constitute legal, financial, investment, or tax advice.