
LoanStreet Monthly Newsletter — February 7, 2024
We are pleased to welcome you to the inaugural edition of The LoanStreet Beat, LoanStreet’s review of recent economic, credit union and participation market news and data. We hope you find the information provided herein to be timely, useful and thought-provoking. Each issue will highlight some relevant economic news and what we at LoanStreet are seeing in terms of market activity. We’ll also take a deeper dive into a particular topic. In this issue’s Market Insights, we explore the historic relationship between the Manheim used car index and credit union used car loss ratios and potential implications for auto loans. We welcome any feedback, questions or comments below on any of the topics mentioned here, or in fact, any topic at all!
LoanStreet Commentary
Last week’s Fed decision and job report provided some clarity as to where we stand regarding a rate cut. The Fed was clear that, although recent data suggests cooling inflation, they are in no hurry to start cutting. Their concern is that cutting too soon will leave them in a tough spot should inflation pick back up again. To further support the Fed’s decision, the job report from Friday came in well above expectations, 353k jobs vs the 185k expected, plus average hourly earnings increased by more than double the monthly estimate at .6%. Although we have seen an influx of new layoff announcements, it appears that those workers are able to find new jobs relatively quickly, as job data does not suggest any cooling in the job market. All this suggests that workers are able to find jobs and demand higher wages, which in turn means more spending and could push inflation up. At this time, the easing of inflationary pressures appears largely driven by the supply side. For example, the additional supply of cars is driving auto prices down. Should that impact subside, demand-side strength may be sufficient to drive inflation upwards again. This might be part of the reason for the Fed’s hesitancy in cutting rates.
On the LoanStreet marketplace, January started with a more balanced market, where there was roughly a balance between buyers and sellers. By the end of the month, it quickly turned into a seller’s market, particularly on in-demand assets. We are seeing especially strong demand for HELOC and auto, the demand is flowing over into other asset classes, such as unsecured and RV. Despite the strong job market, buyers are concerned about credit and therefore prefer superprime pools at the expense of higher returns. While there is still a preference for direct loans, with the slowdown in direct originations, buyers have largely accepted the fact that they need to expand their buy box to indirect. General feedback from clients indicates a sharp decline in YOY origination volumes to start 2024, particularly for larger CUs. This shouldn’t come as a shock with higher loan rates starting to take their toll on consumer spending, as well as the difficulty in sustaining the record 2023 origination volumes. Should this trend continue, credit unions will be tempted to drop their loan rates to attract customers. However, with deposit volume low and credit unions being forced to keep their deposit rates elevated in order to attract new funds, as well as to keep their current deposits from leaving, this will likely lead to lower profit margins. To avoid this, credit unions will need to be smart in how they deploy the funds that they do have. Participations continue to offer attractive spreads, in particular when compared to indirect loan originations. Further, this could be a great opportunity for credit unions to partner with non-bank originators. Starting such a partnership from the ground up could offer favorable terms to the credit unions.
Market Insight – Driven to Succeed
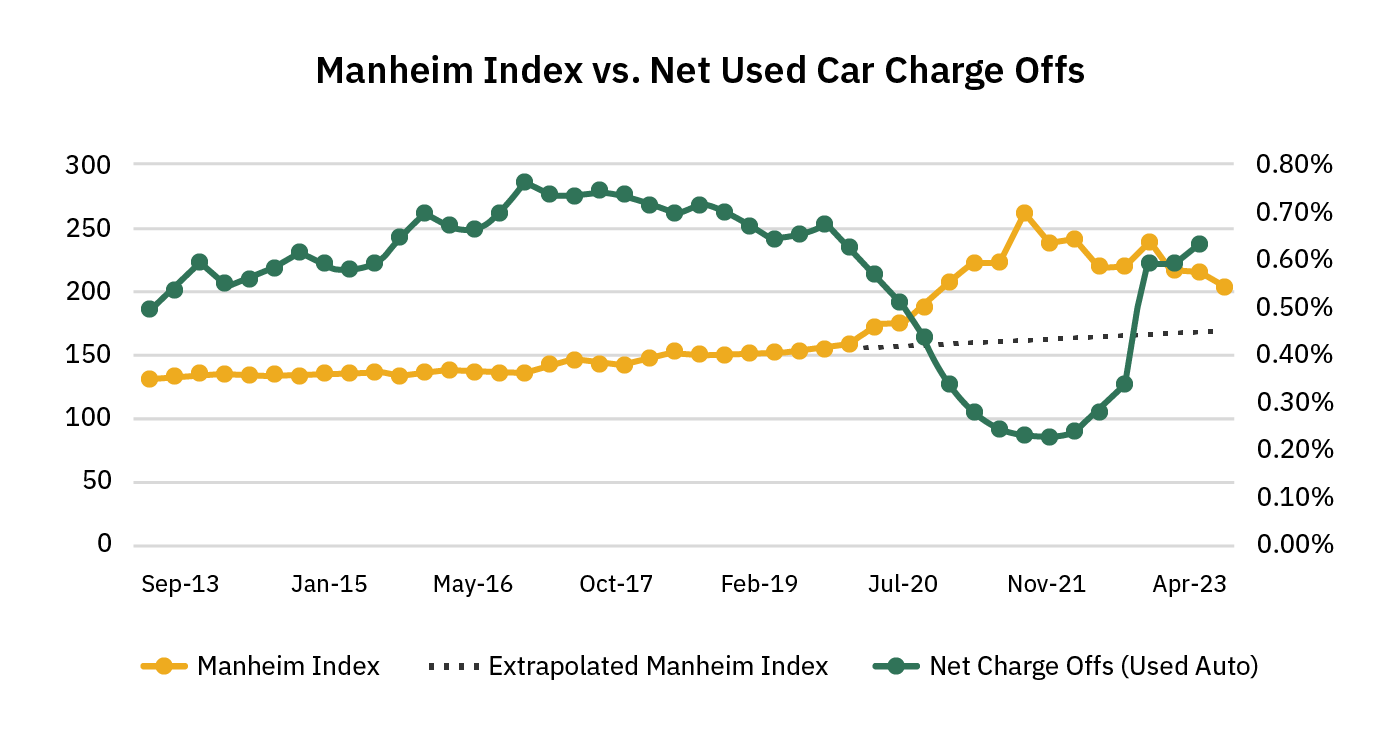
The bread-and-butter for many credit unions is used auto loans, and since COVID-19, used auto loans have experienced low loss rates, to the benefit of the holders of those loans. The following graph shows the historic trends in the Manheim Used Vehicle Index and the net charge-off rate on used auto loans as reported by credit unions in their call reports as aggregated by Callahan & Associates (end-of-quarter Manheim Index levels are used to coincide with EOQ reporting of net losses)
Source: Callahan & Associates
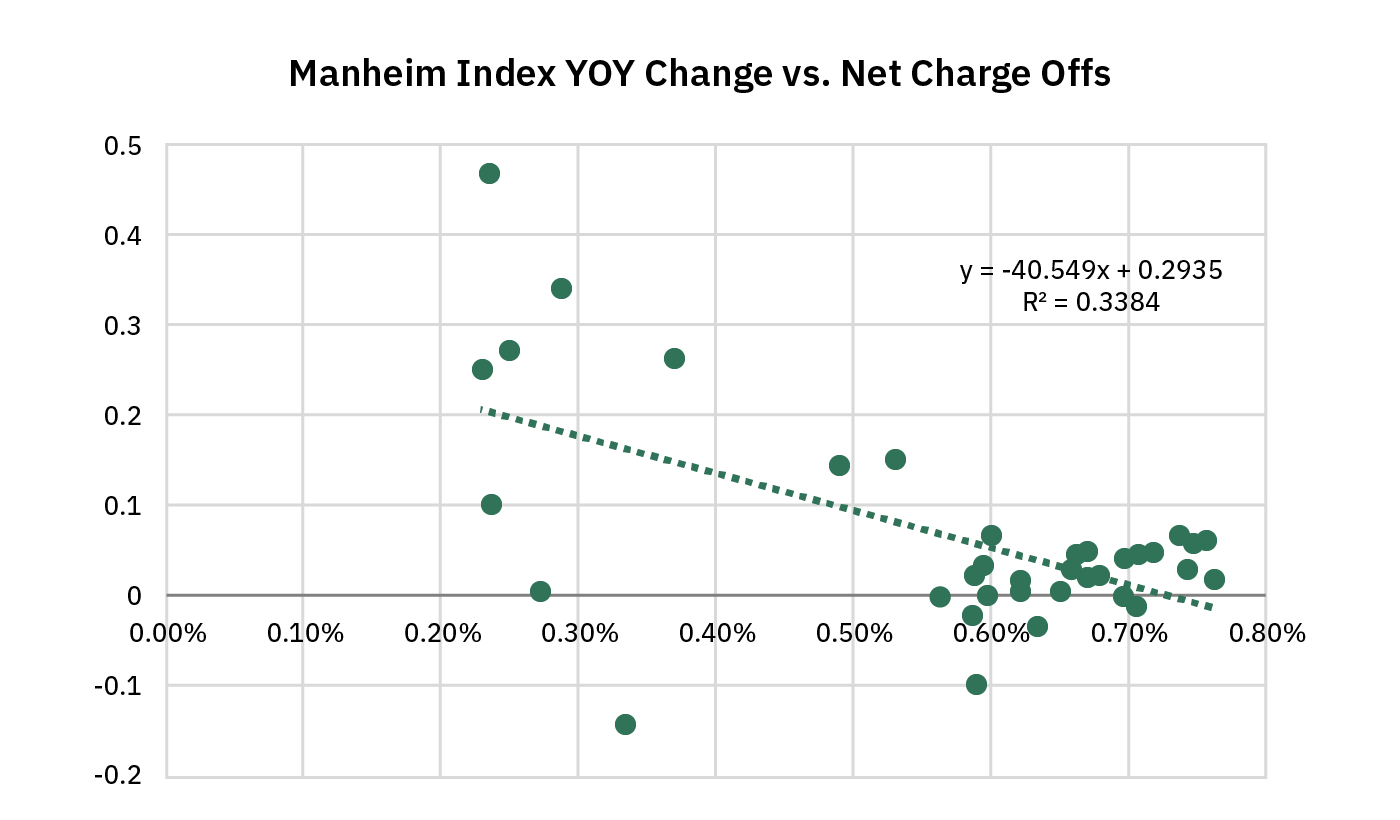
Looking at the data in a slightly different fashion, the 1-yr change in the Manheim Index vs the net charge-off rate gives the following relationship
Source: Callahan & Associates
Higher used car prices reduce net charge-offs for two reasons – first, they reduce the loss severity on defaults since the repossessed vehicles are worth more (with the exception of significantly damaged/destroyed vehicles), and second, they reduce the likelihood of default as it gives some distressed borrowers the remedy of selling their vehicle to cover, and sometimes, exceed, the loan balance. Other factors also entered into reducing net losses during that time, most notably, government support checks to individuals, but also the impact of significantly increased credit union auto loan originations depressing net losses (see our Static Pool paper), as well as any credit tightening done at the time.
With supply-chain issues mostly resolved, and new auto supply recovering, the demand for used autos will likely ease. Additionally, captive finance companies have dusted off their 0% financing offers, which will help drive volume to new cars, often generating trade-ins of used cars. Both of these will help take the pressure off of used car prices. Should the Manheim index decline to its pre-covid historic trend, that would imply a drop of approximately 24% in used car prices. Furthermore, government support checks have ended, and origination volume has declined, two other factors that helped reduce net losses. So where should a credit union anticipate net loss rates to go for used auto loans? A decline in the Manheim Index of the magnitude mentioned above is unprecedented in recent Manheim Index history, and it is risky to extrapolate based on the data available, but it would seem that, at a minimum, net loss rates should revert to their historic averages of 70 to 80 bps, but there is good reason to be concerned that net loss rates will rise significantly more.
Credit unions should keep a close eye on trends in recovery and net loss rates in their used auto book. Recent net losses have been pushed down by abnormally high recoveries on repossessed vehicles which could give a false sense of security when it comes to their loss assumptions going forward, and, therefore, in setting their loss reserves. It’s also important to have a clear understanding of the loan vintages in your portfolio. Loans originated from 2021-2023 are most likely to feel the greatest impact from declining used vehicle values.
Monthly Economic Data Summary
- Based on the 2/2/2024 job report, 353k jobs were added in January vs the expectation of 185k. Additionally, hourly earnings increased at .6%, more than double the monthly estimate.
- The jobless claims climbed to 224k, based on the 2/1/2024 report, the highest reading in 3 months. In addition to the report, a large number of major companies announced layoffs in January, such as; UPS, Citigroup, Meta, Microsoft and many others.
- On 1/26/2024 we received the latest PCE report, the preferred inflation gauge used by the Fed. The annualized 6-month Core PCE came in below the Fed 2% target at 1.9%.
- MoM the 2 and 10 year treasury yields are up ~10bps. This does not tell the whole story as January was a very volatile month when it comes to rates. Peak-to-trough, the 2 year moved between 4.47% and 4.12%.
- Based on the CME market watch tool, the expectations of a March rate cut moved from 68% on January 5th to 15% as of February 5th.
- The Manheim Market Report for mid-Jan showed used car prices declining 1.0% MOM and 10.2% YOY.
- Case-Shiller showed national home prices rising by 0.24% MOM and 5.16% YOY on a seasonally adjusted basis. These are lagging data and reflect the CS indices for 11/23.
This article was authored by Eric Marcus, Managing Director and Head of Trading, and Matt Rudzinski, Director of Sales and Trading.
For more market commentary and to learn more about LoanStreet’s solutions, visit www.loan-street.com
Disclaimer
LoanStreet is not a Registered Exchange, Financial Planner, Investment Adviser, or Tax Adviser. The information provided herein is for general informational purposes only, and does not, and is not intended to, constitute legal, financial, investment, or tax advice.